MEASURE
UNDERSTAND
IMPROVE
Visitor Analytics
See how guests move, engage, and respond across your venue.
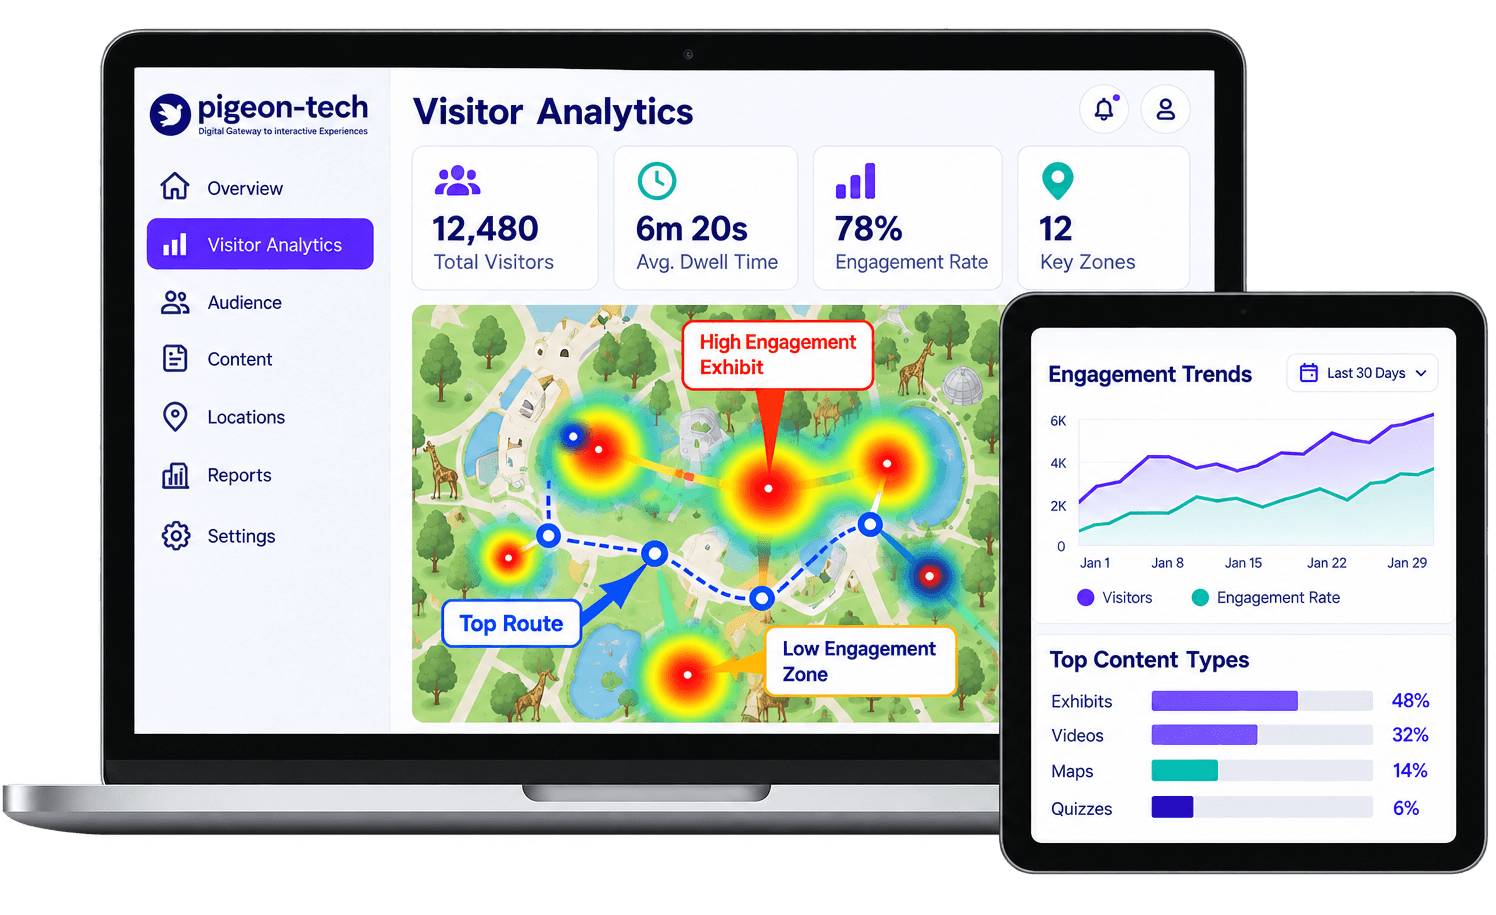
From visitor signals to smarter decisions
Our analytics layer helps you understand what visitors do, where they engage, and where improvements are needed.
Collect Signals
Capture anonymized data from app activity, content interactions, zones, and feedback touchpoints.
Analyze Behavior
View traffic patterns, dwell time, content engagement, and drop-off trends.
Improve Experiences
Use insights to refine layouts, staffing, content, promotions, and visitor journeys.
Powerful insights for your venue
A digital wayfinding system designed for real visitor needs.
Visitor Flow Analysis
See how guests move through the venue.
Dwell Time & Zone Engagement
Identify where visitors spend time and which areas underperform.
Content & Feature Performance
Track taps, scans, views, and interactions.
Actionable Dashboards
Turn visitor behavior into clear reports and operational decisions.
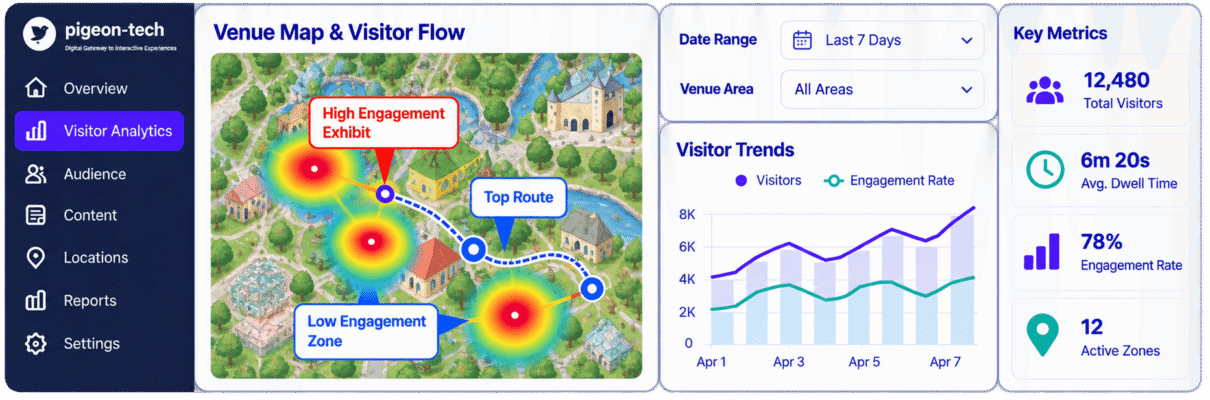
See patterns behind the visit
Example analytics dashboard showing visitor flow, dwell time, engagement trends, and top and low-performing zones.
Value for Visitors and Venue Teams
For Experience Teams
For Leadership & Operations
Explore Related Pigeon-Tech Experiences
Dynamic density & flow mapping
Guided visitor routing & maps
Targeted visitor personas & behavior
Your brand, our technology
See Visitor Analytics in Action
Frequently Asked Questions
Visitor analytics is the process of measuring how visitors interact with a digital experience, such as an app, interactive map, exhibit page, event listing, game, survey, or other configured feature.
Pigeon-Tech Visitor Analytics can help venue teams understand which digital experiences visitors use, what content receives attention, and where engagement is stronger or weaker. Depending on the deployment, analytics may also include configured zone, location, scan, or navigation interactions.
The goal is to turn visitor activity into information that can support better content, layout, programming, and experience decisions.
Visitor analytics works by recording configured interactions within the digital visitor experience.
For example, a venue may choose to measure activity such as:
1. Screen or page views
2. Exhibit or attraction interactions
3. Map and navigation activity
4. Content clicks
5. Event or program interactions
6. QR, NFC, or other configured scans
7. Game or quiz participation
8. Survey responses
9. Session activity
These interactions can then be organized into dashboards or reports so venue teams can understand how visitors are using the experience.
The exact events collected depend on the features, analytics configuration, and integrations included in the deployment.
Pigeon-Tech can measure configured digital visitor interactions across supported parts of the visitor experience.
Depending on the implementation, this may include:
1. Popular exhibits or attractions
2. Frequently viewed content
3. Interactive map activity
4. Navigation and destination selections
5. Audio, video, text, game, or other content engagement
6. Event and program interactions
7. Treasure hunt or quiz participation
8. NFC, QR, or other configured interactions
9. Survey and feedback responses
10. Session and engagement activity
Location-based or physical movement analytics require the appropriate venue technology and configuration and should not be assumed to be available in every deployment.
Pigeon-Tech can support dwell-time and zone-engagement analysis when the required analytics and location or interaction signals are available in the deployment.
For example, a venue may be able to understand:
1. How long visitors interact with specific digital content
2. Which zones or destinations receive more engagement
3. Which exhibits or experiences are frequently selected
4. How engagement changes across different parts of the visitor journey
The meaning of “dwell time” depends on the data being collected. Digital content dwell time, app session time, and physical presence within a venue zone are different measurements and may require different technologies.
During implementation, Pigeon-Tech should define exactly what is being measured and how the data is generated.
Visitor analytics is the broader view of how visitors interact with a venue’s digital experience, while a heat map is one way of visually presenting certain activity or location data.
Visitor analytics may include information such as:
1. Content engagement
2. Exhibit interactions
3. Navigation activity
4. Session behavior
5. Surveys and feedback
6. Game participation
7. Scans or taps
8. Zone engagement
A visitor heat map focuses specifically on showing patterns spatially, such as areas with relatively higher or lower recorded activity.
In Pigeon-Tech, heat maps can therefore be used as one component of a broader visitor analytics strategy.
Explore Interactive Heat Maps
Yes. Pigeon-Tech Visitor Analytics can support digital visitor experiences across both indoor and outdoor venues.
Digital interaction analytics, such as content views, map interactions, surveys, games, or scans, can be collected regardless of whether the venue is primarily indoors or outdoors.
Physical location or movement analytics may require additional technologies depending on the environment. For example, outdoor experiences may use different positioning methods than indoor museums, aquariums, or exhibit spaces.
The appropriate analytics and positioning approach should be defined for each venue during solution design.
Relevant industries include: museums, zoos, aquariums, theme parks, fairs, festivals, conferences, and destinations.
Pigeon-Tech can integrate with existing systems when the required APIs, data access, and technical permissions are available.
Depending on the organization and implementation, integrations may include systems such as:
1. Ticketing platforms
2. Membership systems
3. Event or schedule systems
4. CRM platforms
5. Content management systems
6. Other approved third-party platforms
Integrations can help connect visitor engagement information with other operational or customer data, but the exact integration capability depends on the third-party system and the scope of the project.
Yes. Pigeon-Tech can provide a white-labeled visitor experience using the organization’s branding, including its logo, colors, content, and configured visitor journeys.
Visitor Analytics can operate behind that branded experience so authorized venue teams can review supported engagement and interaction data.
The visitor-facing experience remains aligned with the organization’s brand, while analytics and administrative capabilities are provided through the configured Pigeon-Tech platform.
Data access, reporting, integrations, and administrative permissions should be defined as part of the deployment.
Explore White-Label Platform
Visitor analytics does not need to identify an individual person in order to provide useful engagement insights.
Many analytics use cases can be based on aggregated or anonymized interaction data, such as content views, map selections, scans, sessions, or zone activity.
If a deployment uses authenticated accounts, memberships, personalization, or other identifiable data, the data collected and its permitted use should be defined according to the organization’s requirements, applicable privacy obligations, and the agreed implementation.
Pigeon-Tech should collect only the data required for the intended visitor experience and analytics purpose.